Key Metrics for Measuring AI-Driven Cart Recovery
Most cart recovery dashboards overstate performance. If 20% to 40% of abandoned carts would convert anyway, gross recovered orders are not enough. I’d judge AI recovery on incremental lift, net revenue, time-to-conversion, and 12-month customer value - not sends, not opens, not platform-reported recovery alone.
Here’s the short version:
- I’d set a pre-AI baseline first: abandonment volume, recovery rate, AOV, conversion, deliverability, and recovered revenue.
- I’d run a 5% to 10% holdout for 2 to 4 weeks to measure what the flow added above organic conversions.
- I’d track all 10 core metrics: cart abandonment rate, recovery rate, channel recovery rate, recovered revenue, net revenue uplift, contact rate, engagement rate, time-to-conversion, repeat purchase rate, and 12-month CLV.
- I’d keep attribution tight with a fixed 24- to 48-hour window, tracked links, and channel-level reporting.
- I’d compare email, SMS, and AI voice by profit per recovered order, not just recovered order count.
That changes how I read channel performance. SMS often beats email on recovery rate and revenue per recipient. AI voice fits high-intent, high-AOV carts where a reminder isn’t enough and the buyer needs back-and-forth before purchase.
Recover Lost Sales with Auto AI Calls (Shopify Cart Abandonment)

sbb-itb-c569085
Quick comparison
| Area | What I’d watch |
|---|---|
| Baseline | Pre-AI abandonment, conversion, AOV, deliverability, recovery |
| True performance | Holdout-adjusted lift, not gross recovered orders |
| Revenue view | Recovered revenue, net revenue uplift, revenue per message |
| Channel view | Email vs. SMS vs. voice by recovery rate, speed, and profit |
| Long-term view | Repeat purchase rate, 30-day revisit rate, 12-month CLV |
The main point is simple: AI recovery only counts if it drives sales you would not have gotten otherwise - and does it without crushing margin.
Why You Need a Baseline Before Measuring AI Performance
Start with a pre-AI baseline. If you skip this, every number after launch gets harder to read.
Track the core inputs first: monthly cart abandonment volume, average cart value, checkout completion rate, recovery rate, deliverability, engagement, conversion, and recovered value. Email recovery averages around 20.8% and SMS recovery averages around 26.2%. Those figures give you a clean starting line for recovery rate, recovered revenue, and net revenue lift.
Don’t stop at platform-reported recovery. Run a holdout test by excluding 5% to 10% of shoppers from the recovery flow for 2 to 4 weeks. That control group tells you what would’ve happened anyway. Without it, gross recovery can look better than the actual lift.
Keep the test design fixed. Keep the attribution window fixed too. Cart recovery needs a short window because purchase intent drops off fast. That’s how you measure incremental lift instead of taking credit for orders that were already on the way.
Timing matters more than most teams admit. Black Friday, Cyber Monday, and year-end holiday shopping can push intent up across the board and make a recovery program look stronger than it is. Compare performance against the same period last year, or use a rolling 30-day average outside peak periods. Those benchmarks give the next set of metrics some context instead of leaving you with inflated top-line recovery numbers.
1. Cart Abandonment Rate
Cart abandonment rate is the share of shoppers who put something in the cart, then leave without buying. It tells you how big the recovery pool is before email, SMS, or voice does any work.
Formula
Cart Abandonment Rate = (1 - [Completed Transactions ÷ Carts Created]) × 100
Count every cart creation event. That includes carts where the shopper never starts checkout and never gives you contact details.
Once you know the leak, you can put a dollar figure on revenue at risk.
Why It Matters
About 70.19% of online carts get abandoned, which makes this one of the biggest recoverable leaks in e-commerce. That rate sets the top end of what your recovery program can work on. If abandonment is high, the pool is big. If it’s low, your recovery ceiling is lower too.
It also gives you the baseline for measuring AI recovery performance. No baseline, no clean read on lift.
Channel Attribution
Don’t stop at one blended number. Break abandonment rate out by source and device. That’s where you’ll find the ugly stuff: paid social on mobile, affiliate traffic with weak intent, or desktop sessions that stall at shipping.
High abandonment can still be worth a lot. In many cases, it points to shoppers with clear buying intent who just didn’t finish on the first visit. That’s why this metric matters beyond a single order.
Use this as the starting point for the next metric: how much of that abandoned volume AI gets back.
2. Abandoned Cart Recovery Rate
Cart abandonment rate tells you how big the hole is. Recovery rate tells you how much money you pulled back. If you want a clean read, use delivered messages as the denominator. Not sends. Sends include attempts that never hit the inbox or phone. Delivered is actual exposure, and that’s the number you can judge performance against.
Formula Clarity
For a campaign, calculate: (Recovered carts ÷ Delivered recovery messages) × 100.
That distinction matters more than most teams think. Sent means the platform tried. Delivered means the shopper had a shot at seeing it. If 10,000 messages were sent but only 8,700 landed, your recovery rate should run off 8,700, not 10,000. Otherwise, you’re grading the program on inventory it never had.
Revenue Impact
Don’t look at recovery rate alone. Put it next to revenue per message so you can judge output, not just conversion. A channel can post a higher recovery rate and still drive less cash if AOV is lower or message volume is weak.
Channel Attribution
This only works if every message carries unique, trackable links. No exceptions. You need one tracked link per message so each recovered order maps back to a single outreach attempt. That’s how you know which send drove the sale instead of guessing across a flow.
Once that tracking is clean, break recovery rate out by channel. Put email, SMS, and voice side by side. That shows where AI is pulling back the most carts and which channel is doing the heavy lifting.
3. Channel-Specific Recovery Rate
Once you’ve got the overall recovery rate, split it by channel. Email, SMS, and AI voice do not pull the same numbers. If you roll them into one blended figure, you miss what’s doing the work. That’s why channel-level recovery is the metric that shows whether AI is paying off or just taking credit.
Formula Clarity
Use the same math for each channel on its own: (Recovered orders attributed to channel ÷ Total abandoned carts targeted by that channel) × 100. Keep the attribution window consistent across every channel - 24 to 48 hours is the standard here.
Revenue Impact
Recovery rate only tells part of the story. The other half is revenue per recipient (RPR): total revenue tied to the channel divided by total recipients. That’s the number that shows which channel is driving dollars, not just conversions.
SMS is usually the one to watch. For e-commerce flows, SMS cart recovery can drive $3.07 to $10.78 in revenue per recipient, and it posts a 26.2% recovery rate versus 20.8% for email.
Use the comparison below to judge which channel converts best, not just which one gets the most sends.
| Metric | SMS | AI Voice | |
|---|---|---|---|
| Recovery Rate | 26.2% | 20.8% | High-intent segments |
| Time to First Response | ~3 minutes | ~24 hours | Real-time |
Voice should sit in its own bucket. It runs on conversation, not clicks. That means AI voice needs its own tracking setup, and it fits best on high-intent carts where the shopper needs live objection handling rather than another reminder.
Channel Attribution
For AI voice, unique promo codes or dedicated landing pages usually beat click-based tracking for attribution. Click data misses too much when the sale happens after a call or text follow-up.
Once buyers touch more than one channel before they convert, attribution gets messier. In that case, a time-decay or linear attribution model tends to give a cleaner read because it gives more weight to the last touch while still giving some credit to the earlier ones.
Retention Value
Recovery rate on its own can fool you. If a channel recovers carts but burns the list, the math falls apart later. Track opt-outs next to recovery rate so you can spot fatigue by channel before it turns into a deliverability or list-growth problem.
4. Recovered Revenue
Recovered revenue is the sales dollars tied to your cart recovery flows. It’s the cleanest top-line read on output. But it’s still a gross number. Net revenue uplift tells you what’s left after message costs, discounts, and any other recovery spend.
Formula Clarity
Add up all sales tied to recovery messages inside a set attribution window. That gives you recovered revenue.
To make the number more useful, pair it with Revenue Per Message (RPM): total attributed revenue divided by total messages delivered. This is where weak volume gets exposed. A flow can post $20,000 in recovered sales and still underperform if it needed 200,000 sends to get there.
For SMS, the benchmark is strong: abandoned cart automations generate a median of $3.94 in revenue per send.
Revenue Impact
This is why SMS usually does the heavy lifting in recovery programs. Automated SMS can recover 8% to 15% of revenue that would have been lost otherwise. For a brand leaving $500,000 in abandoned checkout demand on the table each month, that’s roughly $40,000 to $75,000 recovered from SMS alone, before you net out costs.
Channel Attribution
Attribution needs to be tight, or this metric gets inflated fast. Use unique links, promo codes, or dedicated landing pages so each purchase maps back to one recovery touch.
Just as important: only count revenue above the holdout baseline. If a buyer would’ve come back anyway, that sale doesn’t belong in recovered revenue.
Retention Value
Don’t stop at the first order. Track which channel brought the buyer back, then watch what those buyers do next. Some channels recover more first purchases. Others bring back customers who order again in 30, 60, or 90 days. That difference matters when you decide where to put more send volume.
Recovered revenue gives you the starting line. Net revenue uplift is what tells you whether those recovered dollars were worth the cost.
5. Net Revenue Uplift
Recovered revenue shows what came back in the door. Net revenue uplift shows what you kept after the costs hit. That’s the number that tells you if your recovery program made money or just moved revenue around.
Formula Clarity
Net revenue uplift = gross recovered revenue - discounts and free shipping - messaging, platform, and labor costs.
This is where a lot of teams get sloppy. Gross recovery can look strong on a dashboard, but once discounts start stacking up, margin gets chewed up fast.
Revenue Impact
Heavy discounting can make recovery numbers look better than they are. You might recover more carts on paper while net uplift drops in the background. If you’re handing out 15% off plus free shipping to save low-intent carts, the top-line recovery rate can improve while profit per order gets hit.
Incrementality
A holdout group gives you the clean read. Start with the baseline you set before launch, keep a portion of shoppers out of the recovery flow, and measure what would have converted without outreach. The gap between the messaged group and the holdout is your true lift. Everything else is noise.
Retention Value
AI can vary incentives by shopper to protect margin. That protects margin on each recovered order.
That matters when you’re comparing channels. Email may drive more recovered orders. SMS may cost more per send but still produce better profit. Voice may recover fewer carts but win on high-AOV checkouts. Net uplift lets you compare email, SMS, and voice on profitability, not just volume.
6. Contact Rate
Contact rate is the share of abandoned cart shoppers your outreach actually reaches. That’s the number that matters. Sending 10,000 messages means nothing if 3,000 never land.
Contact rate sets the ceiling for every recovery metric after it. No delivery means no open, no click, no order.
Formula Clarity
Contact Rate = (Shoppers who received the message ÷ Total Abandoned Cart Shoppers) × 100
For channel-level tracking:
- SMS/email delivery rate = (Delivered Messages ÷ Total Sent Messages) × 100
- AI voice connect rate = (Connected Calls ÷ Total Call Attempts) × 100
Track reached shoppers, not message attempts. “Sent” only tells you the platform made an attempt. It does not mean the shopper got the message or had a chance to act on it. Break this out by channel so you can see where reach is strong and where it’s falling apart.
Revenue Impact
This is the first gate in cart recovery. If contact rate is weak, the rest of the funnel is capped before it starts. Good copy won’t save it. Better timing won’t save it. A discount won’t save it.
Channel reach isn’t even close. SMS has a ~98% open rate, and about 90% of messages are read within 3 minutes of delivery. Email open rates usually sit around 20% to 22%. That gap changes how much revenue each channel can even touch.
Retention Value
High contact rate helps only if you protect list health. Send useful messages. Don’t hammer people. Skip late-night and early-morning sends, and use local daytime hours.
Watch unsubscribes closely. When that number climbs, future reach drops with it. Once contact is there, the next thing to watch is engagement rate.
7. Engagement Rate
Delivery only gets you to the starting line. Engagement rate tells you whether the shopper actually did something after the message landed: (Total interactions ÷ Delivered messages) × 100.
The action depends on the channel. For email, that usually means a tracked link click. For SMS, count link clicks and two-way replies. For AI voice, look at answered calls, conversation length, and detected intent. Keep channel reporting separate, or attribution gets muddy fast.
Revenue Impact
Strong clicks with weak conversion usually point to a downstream problem, not a messaging problem. Most often, it's page speed, checkout friction, or no autofill.
The spread between channels is hard to ignore. SMS click-through rates often sit between 21% and 35%, while email usually lands around 3.2% to 6%. At volume, that difference shows up in recovered revenue pretty fast. Engagement is the handoff between reach and conversion.
Channel Attribution
Break engagement out by channel so each action stays tied to the right source. That means email clicks, SMS replies and clicks, and answered voice calls should each stand on their own. If you blend them together, you'll lose the signal you need to decide where the next dollar goes.
Retention Value
Reply rates in two-way programs are one of the clearest signs that the message fits the shopper and that AI personalization is doing its job. Track opt-outs next to engagement, not in a separate report. High clicks with rising unsubscribes usually means the offer pulled attention, but the experience missed the mark. The next step is timing: how fast engaged shoppers turn into buyers.
8. Time-to-Conversion
Once a shopper re-engages, the next thing to watch is how fast they buy. Time-to-conversion = completed purchase timestamp − cart abandonment timestamp.
This metric matters because intent drops off hard. Conversion probability falls by about 60% in the first hour after abandonment. That’s the window where recovery programs either pull money back or let it slip away.
The gap between fast sends and delayed sends is big. Recovery messages sent within 5 minutes can hit a 36% click-through rate, versus 9% for scheduled broadcasts. Same shopper type. Same basic goal. Very different outcome.
Revenue Impact
Speed protects revenue. If you reach shoppers while intent is still warm, you cut the odds that they buy from a competitor or just move on. The conversion lift backs that up: emails sent within 60 minutes of abandonment convert at 2.3x the rate of emails sent 12 hours later.
For most brands, that means time-to-conversion isn’t just a reporting metric. It’s a read on how much demand the flow is saving versus wasting.
Channel Attribution
This also affects how you assign credit. SMS, email, push, and retargeting don’t move on the same timeline, so if each channel uses a different attribution window, reporting gets messy fast.
Use a 48-hour attribution window across the recovery flow. It’s long enough to catch multi-touch paths, and short enough to avoid giving too much credit to touchpoints that landed well after the buying decision.
Retention Value
There’s a second payoff here. Faster re-engagement usually means a shorter path back to purchase. Shoppers who come back and convert fast are also more likely to buy again later.
That makes time-to-conversion more than a recovery KPI. It’s an early read on repeat purchase behavior.
9. Repeat Purchase Rate
Repeat purchase rate tells you if a recovered cart turned into a customer who came back and bought again. That’s the line that matters. Recovering the first order is good. Getting the second order is where the economics start to look better.
Formula Clarity
Take the number of recovered customers who made at least one later purchase and divide it by the total number of recovered customers in that cohort. Keep the tracking window tied to the category’s repurchase cycle. If you sell supplements, 30 to 60 days may be enough. If you sell furniture, that window needs to be longer.
Revenue Impact
A recovered customer who buys again is worth more than a one-time recovered order. That sounds obvious, but it changes how you judge recovery performance. A flow that recovers $25,000 but drives weak second-order behavior can be less useful than one that recovers $18,000 and produces more repeat buyers.
Channel Attribution
Don’t look at recovered customers in isolation. Compare repeat purchase rate for recovered customers against a holdout group to measure incremental lift. That’s how you separate “these people were going to buy again anyway” from actual lift driven by the recovery program.
Retention Value
This is the metric that shows whether AI recovery created a customer, not just a transaction. A shopper who abandons a cart, gets recovered, and then returns for another order has more long-term worth than the first order alone suggests.
Watch the first 30 days closely. Declining follow-up engagement in that period often shows up before lower repeat purchase rates do. If email clicks, SMS replies, or post-purchase session rates start to slip, second-order rate often follows.
Use repeat purchase rate to judge whether recovery created durable value; the next step is measuring CLV.
10. Customer Lifetime Value of Recovered Customers
Repeat purchase rate tells you if recovered shoppers buy again once. 12-month CLV tells you what that shopper is worth across the full year.
Formula Clarity
Track 12-month CLV with three inputs: recovered revenue, repeat orders, and recovery cost. Then compare the messaged group against the holdout. That’s how you separate reported revenue from incremental lift.
Revenue Impact
Recovered revenue from a single order shows the outreach did its job. CLV shows whether the math still works 12 months later. Re-engaging a lost customer can double their lifetime value, and retention is roughly five times cheaper than acquiring a new customer.
That matters when offers get aggressive. A discount-led recovery can still produce more margin over time if second and third orders cover the incentive cost. Without clean attribution, though, you can’t tell if the campaign drove that value or just took credit for demand that was already there.
Channel Attribution
Use:
- unique links
- a fixed attribution window
- holdout testing
That gives you a cleaner read on incremental CLV by channel, not just top-line recovered sales.
Retention Value
This is where the retention picture gets sharper. A shopper who abandons a cart, comes back through AI outreach, and places another order over the next 12 months is not the same as a one-and-done recovery.
Track CLV by recovery channel and you’ll see which touchpoints produce repeat buyers versus one-time orders. That’s the difference between $50 recovered today and $200 from the same customer over the next year.
Channel Comparison: Email, SMS, and AI Voice
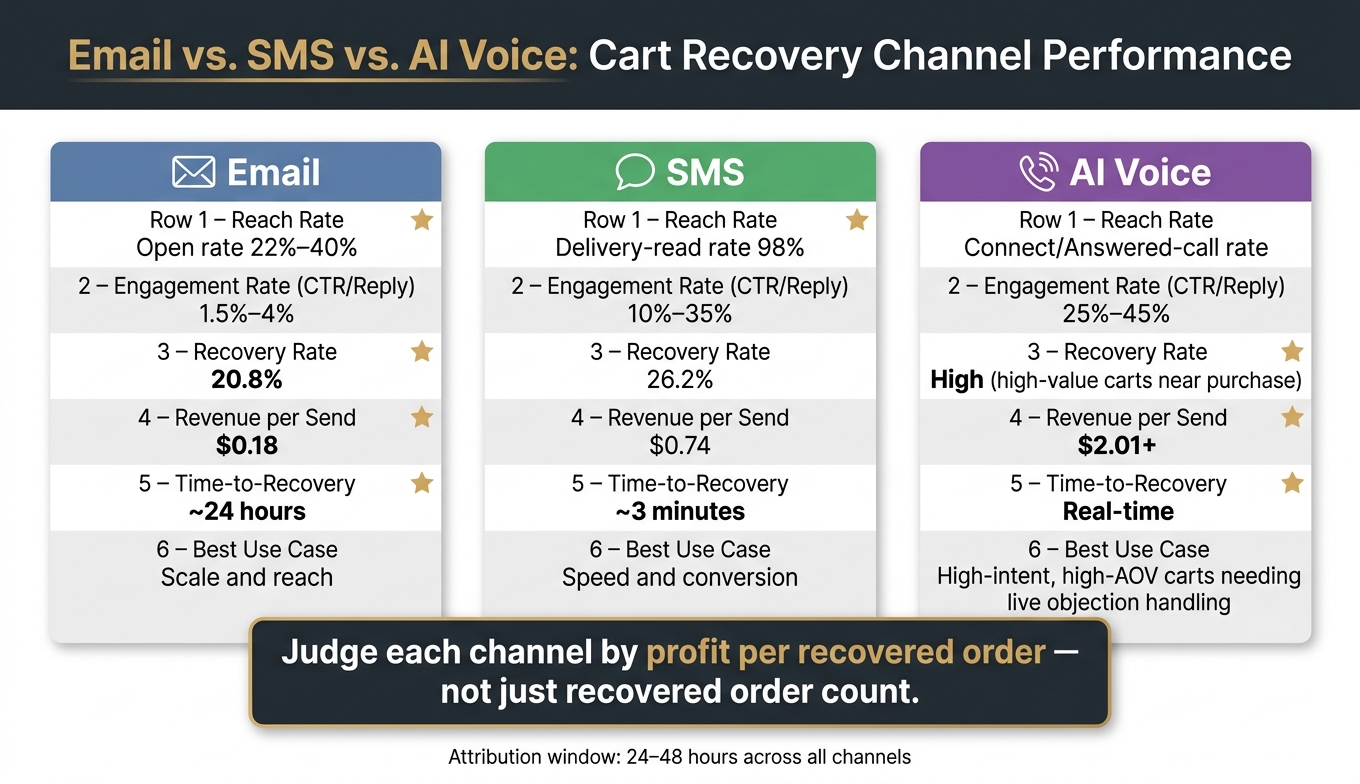
Email vs. SMS vs. AI Voice: Cart Recovery Metrics Compared
Email, SMS, and AI voice do different jobs in cart recovery. Email gives you reach at scale. SMS wins on speed. AI voice steps in when a shopper needs live back-and-forth before they buy. That also means you can't grade all three the same way.
| Metric | SMS | AI Voice | |
|---|---|---|---|
| Reach Rate | Open rate: 22%–40% | Delivery-read rate: 98% | Connect rate / Answered-call rate |
| Engagement Rate (CTR/Reply) | 1.5%–4% | 10%–35% | 25%–45% |
| Recovery Rate | 20.8% | 26.2% | High (high-value carts near purchase) |
| Revenue per Send | $0.18 | $0.74 (automated) | $2.01+ (conversational) |
| Time-to-Recovery | ~24 hours | ~3 minutes | Real-time |
| Avg. Recovered Order Value | Standard | Standard | Higher with personalization |
The gap shows up fast in revenue per send. SMS usually beats email on that line: $0.74 vs. $0.18. AI voice can go higher at $2.01+ for conversational recovery, but the reporting model shifts. Clicks matter less. What matters more is who answered, how long they stayed on, and whether the call moved the shopper to purchase.
That’s where tools like CartConnect.ai fit. They layer in AI voice calls plus two-way SMS follow-ups for late-stage recovery. In practice, that makes AI voice strongest on carts that are close to buying but stuck on one last objection. Shipping cost. Timing. Product fit. Payment friction. Not every cart needs a call. The higher-intent ones often do.
This matters because topline recovery can look good while margin gets worse. So when you look at the next set of revenue and margin metrics, judge each channel by profit per recovered order, not just recovered order count.
Recovered Revenue vs. Margin Protection
Gross recovered revenue tells you how many orders you pulled back. Margin protection tells you whether those orders were worth having. That’s why incentive choice is the margin lever.
Incentives move margin fast. On a $100 order:
| Incentive Type | Expected Conversion Lift | Margin Impact | Net effect on a $100 order | Profitability Note |
|---|---|---|---|---|
| Simple Reminder | Baseline/Moderate | None | $100 | Protects full margin; best for high-intent shoppers. |
| Free Shipping | Moderate | Moderate | ~$85 | Deducts ~$15 in shipping cost. |
| 10% Discount | High | High | $90 after discount | Reduces margin; can train shoppers to wait for discounts. |
| Free Gift | Moderate | Variable | ~$92 | Costs the item's COGS, not its retail price. |
| Bundle Offer | High | Moderate | ~$110 on $130 gross | Lifts AOV, but requires careful COGS accounting. |
The play is simple: use the lightest incentive that still gets the cart back. Simple reminders usually do the best job of protecting margin because they recover existing intent without cutting price. No discount. No extra cost. Just a clean nudge. One-click recovery links can lift conversion without any financial offer.
That changes how you should think about AI. It shouldn’t throw discounts at every cart. It should sort shoppers by intent. High-intent shoppers often need nothing more than a reminder. Price-sensitive shoppers may need a stronger offer, but only after earlier outreach gets ignored. Tools like CartConnect.ai do this through AI voice calls and 2-way SMS follow-ups, serving tailored incentives only when the conversation shows a shopper needs one.
That’s why profit per recovered order is the metric that matters more than top-line recovered revenue.
And that lens matters because a recovered cart only pays off over time if that buyer comes back.
Retention Metrics That Show Long-Term Value
Once you’ve looked at recovery rate and recovered revenue, the next thing to check is simple: do those shoppers come back. Recovered revenue tells you about the first order. Retention tells you if that customer keeps buying.
The cleanest signal here is return-to-site behavior, measured as 30-day revisit rate. That gives you something recovery rate and CLV don’t fully show on their own: whether recovered shoppers stay active after that first purchase, instead of converting once and disappearing.
To read that signal the right way, compare three groups side by side: recovered shoppers, unrecovered abandoners, and non-abandoners. That’s the only way to separate durable long-term value from a one-time recovery bump. If recovered shoppers revisit at a higher rate than unrecovered abandoners, you’re seeing more than a saved sale. If they also hold up against non-abandoners, that’s a stronger sign the channel is bringing in customers worth keeping.
At the same time, use holdout-adjusted reporting to isolate incremental lift. Then pair profit per recovered order with CLV so your retention read stays tied to margin, not just order volume.
Compliance and Outreach Metrics to Track
Once performance is in view, watch the rules and delivery mechanics that determine how much recovery you can even reach. AI-driven recovery falls apart fast if sends go out late, hit people without consent, or never land. Start with consent, timing, and delivery quality. Those three set the ceiling for every recovery number that follows.
Consent coverage is the share of shoppers you can legally contact because you have a valid opt-in on file. Under TCPA, documented affirmative consent is required before calling or texting any customer. That number is your top-of-funnel cap for recovery. If only 62% of abandoners are opted in, the other 38% is off limits for SMS and calls, no matter how good the flow is.
Opt-out rate tells you when suppression is failing. Opt-outs need to sync right away. If that update lags, risk goes up and your reachable audience gets smaller over time.
Local-time send adherence tracks whether outreach respects each recipient’s time zone and avoids sends at noncompliant local hours. This sounds like back-office plumbing, but it matters. A strong message sent at the wrong local time is still a bad send.
Delivery rate shows whether your phone and email data is valid and formatted the right way. For SMS, 95%+ delivery rate is the target. Anything below that usually points to list quality issues, formatting errors, carrier filtering, or all three.
Call answer rate and completion rate show how many attempts turn into answered conversations and how many actually finish. That’s the difference between activity and contact.
Track these next to recovery rate and net uplift so you can tell the difference between outreach that performs and outreach that simply gets sent.
Reporting Checklist for Consistent Measurement
If you want channel reporting to mean anything, start with system alignment. Your ecommerce platform - Shopify, WooCommerce, or Magento - needs to match your recovery platform and your CRM. The non-negotiable fields are phone number or email for identity matching, Order ID for revenue attribution, and cart ID or product ID for cart-level matching.
Next, lock your attribution rules before anyone pulls a report. Use one fixed attribution window across email, SMS, and AI voice. Then tag every recovery link with UTM parameters. Skip that, and SMS clicks can get dumped into “direct” traffic in Google Analytics 4.
ROI math needs to be clean. Report net revenue, not top-line recovered revenue. That means subtracting refunds, cancellations, incentives, and messaging costs before you show channel return.
After the data structure is set, keep reporting on a fixed cadence:
| Cadence | Focus | What to Do |
|---|---|---|
| Weekly | Delivery health | Check delivery vs. sent volume, audit failed messages, and flag technical outliers |
| Monthly | Channel results | Compare recovery rates and revenue across channels |
| Quarterly | Retention and lifetime value | Review repeat purchase rates and CLV by recovered-customer cohort; adjust frequency and targeting |
That monthly review should do more than compare channel totals. Use it to find tracking leaks. Run a cart-to-contact match audit by comparing total add-to-cart events in your ecommerce platform against triggered flow volume in your recovery tool. The gap tells you how many add-to-cart events never turn into trackable contacts. That shrinks the pool you can measure against recovered revenue, net uplift, and CLV.
Conclusion
Measure AI-driven cart recovery on outcomes, not activity. Open rate and send volume tell you the flow is running. Net revenue lift, revenue per recipient, and repeat purchase rate tell you if it’s making money. And those numbers only mean anything when you compare them to a holdout group.
If you add one thing to your setup, make it holdout testing. Hold back 5% to 10% of eligible shoppers from the recovery flow for two to four weeks. That gives you a clean read on whether the AI drove incremental revenue or just claimed orders that would’ve happened anyway.
Revenue alone can fool you. Recovered sales may look strong on a dashboard, but they don’t tell you what you kept. Take recovered revenue, then subtract discount cost and messaging fees. That’s the number that shows what the program earned.
The long-term read comes next. Look at repeat purchase rate and customer lifetime value (CLV) for recovered customers. That’s how you tell the difference between a flow that pulls forward one order and one that brings in customers who buy again. Judge the program on incremental lift, margin, and retention. Those three numbers separate a recovery setup that proves value from one that just keeps sending messages.
FAQs
Which cart recovery metric matters most?
Recovered revenue is the number that matters most. It ties cart recovery work straight to dollars recovered, so it’s the clearest read on financial impact and ROI.
But if you’re judging how well the flow itself is doing, conversion rate is the KPI to watch. It shows whether your recovery sequence and checkout path are turning abandoned carts into completed orders.
Before either metric means much, check delivery rate first. If emails or texts aren’t landing, the rest of the data gets shaky fast.
How do I measure true incremental lift?
Measure true incremental lift with holdout testing. Hold back 5% to 10% of eligible users from a campaign for 2 to 4 weeks. Then compare their behavior against the group that got the message. That gives you the impact of the intervention itself, not orders those customers would’ve placed anyway.
From there, keep the read clean. If you use CartConnect.ai, stack its results next to your SMS and email numbers, and keep the attribution window the same across channels, such as 7 days for cart flows.
When should I use email, SMS, or AI voice?
Use email, SMS, and AI voice as a coordinated sequence, not three separate plays. That’s how you push cart recovery higher.
Email does the heavy lifting on detail. Use it for product context, reviews, UGC, FAQs, and the kind of visual sales pitch that helps someone get over the line. It gives you room to explain why this product and back it up.
SMS handles visibility and speed. It’s your nudge channel. Short message, clear CTA, tight timing. Best when you need urgency and don’t want the buyer to miss it in a crowded inbox.
Then there’s AI voice. Tools like CartConnect.ai fit the tougher recoveries - the carts that didn’t come back from email or SMS. Voice works well when the buyer has friction that a text thread won’t solve: sizing doubt, shipping concern, bundle confusion, payment hesitation. A live-style conversation can clear that up on the spot and make a tailored incentive feel earned instead of blasted to everyone.
The point isn’t to hit people on every channel at once. It’s to sequence them so each one does its job. Email builds the case. SMS adds pressure. AI voice steps in when the cart needs actual conversation.